Play-Mode Profiler
Overview
The Core Editor has a dedicated Performance Window to diagnose performance issues at game creation time, including running the game in Multiplayer Preview mode to simulate client-server scenarios.
But games and especially multiplayer games are beasts of a complicated nature, and it is often much more helpful to have some view into diagnostics with real clients connected to a real server, and see how the same game actually performs on a variety of machines under different gameplay scenarios.
With this in mind, we have introduced a Profiler for published games which can be enabled by game creators and activated by any client playing a published version of that game build.
Enabling and Activation
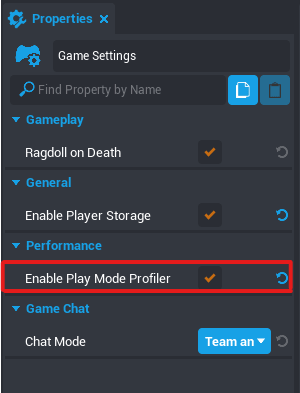
Check the "Enable Play Mode Profiler" option under the Game Settings object in scene and Publish the Game when you are ready.
When playing this published build of your game, press F4 to activate the Profiler View in your game. Pressing F4 again will deactivate the Profiler View.
Any player playing this version of the published build will have access to the Profiler.
Profiler Overview
The Profiler has a tabbed design with a tab each for Client profiling, Server profiling and Logs.
Client Profiling tab
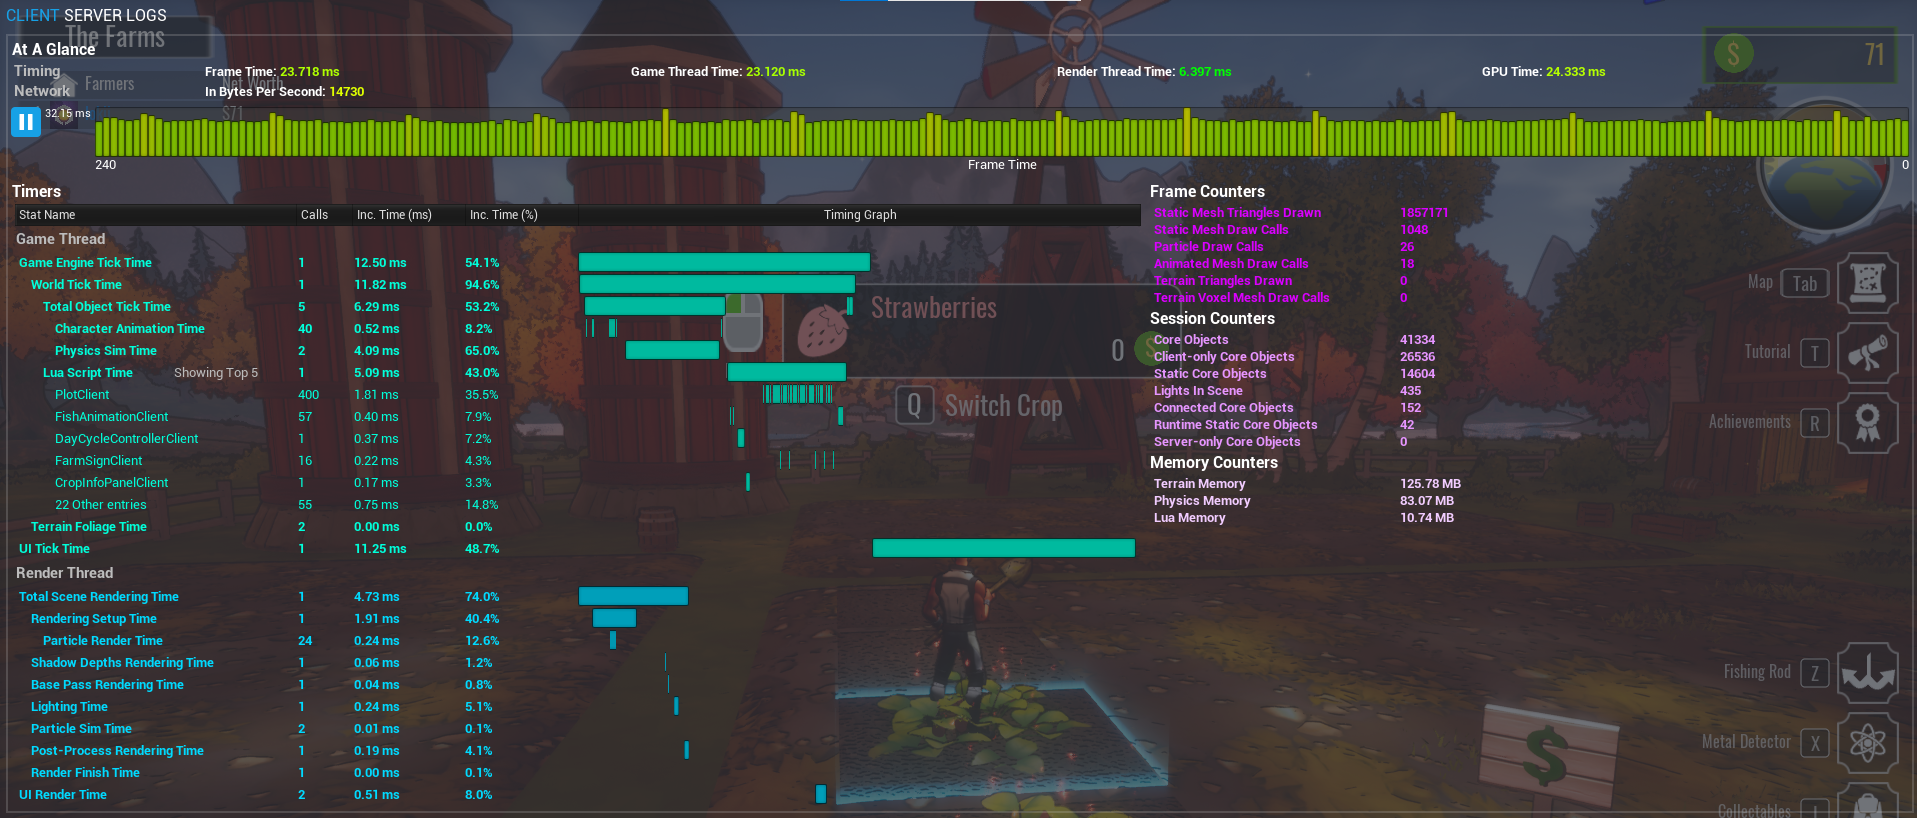
This tab allows you access to performance data from the client-side of the running game. It shows detailed timing data captured on both the Game thread and Render thread, as well as counters for various resources in the game.
Server Profiling tab
This shows performance data for the server instance that the game is connected to.
Some notes to keep in mind:
- Server-side data is for Game-thread only, so all Render thread data is blank.
- Due to the variable amount of Memory associated with Server pod instances depending on the number of Max Players for the game, the Memory counters show a percentage and not absolute MB values (like the ones shown in the Client tab)
- Since the Server has a fixed tick rate of 30 ticks per second, the Frame time will hover around the 33 ms mark even though the Game thread time might be much less.
Logs tab
This has sections for showing the Client Logs and Server Logs.
Note that this only shows the logs that are printed using print() statements in lua scripts. It also shows warning and errors in lua scripts, if any.
This can be useful for helping to debug your game on a live server.
Profiler view Restrictions based on Player role
Player is Creator of Game being played
Server-side profiling is only available for the creator of the game being played.
When the creator joins one of his profiling-enabled games in play-mode and activates the profiler, they will be able to see and access all 3 tabs (Client, Server, Logs) with the Logs tab able to see both the Client and Server logs.
Player is Not a Creator of Game being played
Other players (non-game creators) who are playing a game published with profiling enabled, will only see Client and Logs tab with only the 'Client Logs' section visible.
That's also the view users will get when playing a game locally, since the game is not connected to a live server instance.
Profiler Sections
At a Glance
- This gives an overview of the running performance of the game. The 4 timers are color coded to give an indication of how the frame is performing.
Frame Time Graph
- This gives a running graph charting the Frame time for the last 240 frames. The bars are color coded to give an indication of how the frame is performing.
- The upper left hand side of the graph displays a high-water mark of the highest frame time value seen in given range of 240 frames.
- The graph can be paused to analyze individual frame data in the details section below.
- On resume, the stale frames are marked gray to differentiate between new frames coming in.
Timers
- This section gives a semi-detailed breakdown of times taken by various processes on the Game thread and Render thread.
Frame Counters
- This section gives a breakdown of various stats per frame which would likely affect performance in the scene.
Session Counters
- This section gives a breakdown of various stats over the session, which would likely indicate performance trend as the play session progresses.
Memory Counters
- This section gives a breakdown of various memory-related stats over the session.
- Client profiling tab: The units for memory used are in MB.
- Server profiling tab: Due to the variable amount of Memory associated with Server pod instances depending on the number of Max Players for the game, the Memory counters show a percentage and not absolute MB values
Underlying Threaded Architecture and how it relates to the Profiler View
Game Thread Time (CPU): All the processing logic in the main game loop happens on this thread, including animation, physics, scripts, transforms, and UI updates among other things. The time shown reflects the time taken by the current frame to perform all these activities.
Render Thread Time (CPU): This thread is responsible for mainly figuring out what needs to be rendered, and setting up things that will be needed by the renderer before enqueueing these render commands into the renderer"s command list. The time shown essentially reflects this along with the time taken to move data from the CPU to the GPU.
GPU Time: The actual rendering happens on the GPU and the time measures how long the video card takes to render the scene.
Everything for a frame is first processed by the Game Thread. The results are passed to the Render Thread for submission to the GPU. Finally, the GPU renders the image. This pipeline means that there is a time overlap when processing different frames on different threads, as shown in this image:
| Frame 1 | Frame 2 | Frame 3 | Frame 4 | |
|---|---|---|---|---|
| Game Thread (CPU) | Frame A | Frame B | Frame C | Frame D |
| Render Thread (CPU) | Frame A | Frame B | Frame C | |
| GPU | Frame A | Frame B |
Frame Time:
- Your Frame time is the total amount of time spent generating one frame of the game. Since both the Game and Render threads sync up before finishing a frame, the Frame time is often close to time in one of these threads. Since GPU time is synced to the frame, it will likely be a similar number as the Frame time as well.
- If Frame time is very close to the Game time, you are bottlenecked by the game thread. If Frame time is very close to Draw time, you are bottlenecked by the rendering thread. If neither time is close while GPU time is close, then you are bottlenecked by the video card.
- Frame time is a much more reliable metric to measure performance as compared to Frame rate, since along with showing the time taken to generate one frame of the game, it also shows how consistent the times are over a range of frames. For reference,
- A game running at 60fps is equivalent to each frame taking roughly 16.67 ms
- A game running at 30fps is equivalent to each frame taking roughly 33.33 ms
- A game running at 15fps is equivalent to each frame taking roughly 66.67 ms
Profiler Terminology in Detail
Timers
The Timers section is broken down into stats grouped by the Thread type.
A couple of points to note:
- As mentioned earlier, the Render Thread is essentially tracking the time involved in performing setup for actual rendering like determining visible objects, shadows etc and then enqueueing render commands to be executed by the GPU. It is not actually tracking the time taken to render the scene as given by the GPU time. A more in-depth GPU profiler will be added in a future version.
- There will likely be instances where there is a spike detected but no visible indicator in the detailed stats to explain that spike. This could manifest itself in terms of a gap in the timing visualization or no big change in any of the counters. This is possible since we are not tracking every stat that might take up processing time and resources. In the event that this happens with a game, this can be investigated and if it turns out to be an important stat that we missed out and needs to be tracked, it will be added in a future version to the profiler.
Game Thread Timers
- Game Engine Tick Time: Time taken for the entire Game Engine loop.
- World Tick Time: Time taken by all entities in the world, including Objects, Physics, Cameras, and Scripts.
- Total Object Tick Time: Time taken by all Spawned objects in world.
- Character Animation Time: Time taken for skeletal animations in the world, including player characters, animated meshes, and mounts. This can be lowered by having lesser number of characters and animated meshes in the scene.
- Physics Sim Time: Time taken for all physics simulations in the world, including physics objects, collidable objects and triggers. This can be lowered by reducing the number of physics-based objects in the scene.
- Particle Compute Time: Time taken for particle simulation on CPU. This can be lowered by reducing the number and complexity of particles in the scene
- Total Object Tick Time: Time taken by all Spawned objects in world.
- Lua Script Time: Time taken for running all active Lua scripts.
- World Tick Time: Time taken by all entities in the world, including Objects, Physics, Cameras, and Scripts.
- UI Tick Time: Time taken to update all UI components. This can be lowered by reducing the number and complexity of UI elements in the scene.
Render Thread Timers
- Total Scene Rendering Time: Time taken to render the whole scene.
- Rendering Setup Time: Time taken for object visibility detection and dynamic shadows setup.
- Particle Render Time: Time taken to render particles.
- Particle Sim Time: Time taken for particle simulation on the GPU, including VFX particles.
- Shadow Depths Rendering Time: Time taken for generating depth maps for shadow-casting lights, including the main directional light. This can be lowered by reducing the number of shadow-casting lights in the scene.
- Base Pass Rendering Time: Time taken to submit all visible objects to the GPU. In technical terms, this is essentially the time taken by the Deferred Renderer to render material attributes like base color, roughness, normals to intermediate buffer for use during the Lighting pass.
- Lighting Time: Time taken by the Lighting pass. Takes into account all the different types of lights (shadowed, unshadowed, indirect). This can be lowered by reducing the number of lights in the scene.
- Post-Process Rendering Time: Time taken to render post-process effects. This can be lowered by reducing the number and complexity of post-processing effects in the scene.
- Render Finish Time: Time taken to process and send all enqueued render tasks on to the GPU.
- Rendering Setup Time: Time taken for object visibility detection and dynamic shadows setup.
- UI Render Time: Time taken to render all UI. This can be lowered by reducing the number and complexity of UI elements in the scene.
Frame Counters
- Static Mesh Draw Calls: Draw Calls attributed to static meshes in the scene. This can be lowered by reducing mesh object counts, reducing materials being used or using simpler materials among other things.
- Animated Mesh Draw Calls: Draw Calls attributed to animated meshes (including player characters, mounts) in the scene. This can be lowered by reducing the animated meshes in the scene.
- Terrain Mesh Draw Calls: Draw Calls attributed to terrain in the scene. This can be lowered by reducing the complexity of terrain in the scene, reducing materials being used or using simpler materials among other things.
- Particle Draw Calls: Draw Calls attributed to VFX particles in the scene. This can be lowered by reducing the number and complexity of particles in the scene.
- Terrain Triangles Drawn: Terrain Triangles Drawn. This can be lowered by reducing the complexity of terrain in the scene, reducing materials being used or using simpler materials among other things.
Session Counters
- Core Objects: Total number of objects residing on client currently.
- Static Core Objects: Number of non-replicating objects residing on clients and server, and spawned on initial level load.
- Client-only Core Objects: Number of non-replicating objects residing only on clients.
- Runtime Static Core Objects: Number of non-replicating objects residing on both server and clients.
- Lights In Scene: Number of lights in scene.
Memory Counters
- Terrain Memory: Memory usage for terrain in scene.
- Physics Memory: Memory usage for physics (includes terrain, collision, triggers) in scene.
- Lua Memory: Memory usage for lua scripts running in scene.
Bot Spawning
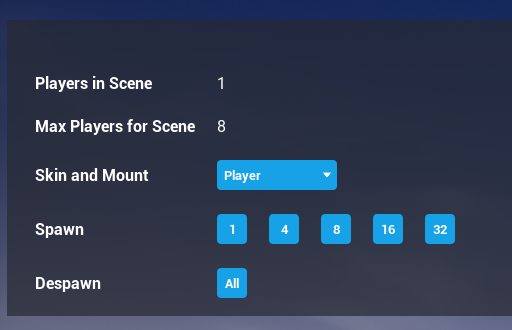
Creators have access to Bot Spawning from the profiler that can be used to test out the performance of their game with multiple players. This is accessible to game owners only.
To access the Bot Spawning options, click the Bot tab in the profiler. This will give you options to spawn bots with random skins, how many to spawn, and the option to despawn them all. As a bot dies, another will fill that spot to maintain the number selected.
Sources
ParallelRendering on the Unreal Engine Wiki | How to Improve Game Thread CPU Performance Unreal Engine Blog


